


APA CORP (NASDAQ:APA) Shows Strong Technicals and Bull Flag Setup
Technical breakout strategies aim to identify stocks that are both technically strong and forming consolidation patterns, suggesting a potential upward price movement. This approach combines two key metrics: a high technical rating, which confirms the stock’s underlying health and positive trend, and a high setup quality rating, which indicates the stock is consolidating in a tight range, potentially offering a favorable risk-reward entry point. By focusing on stocks that perform well in both areas, investors seek to participate in the next leg of a established uptrend.
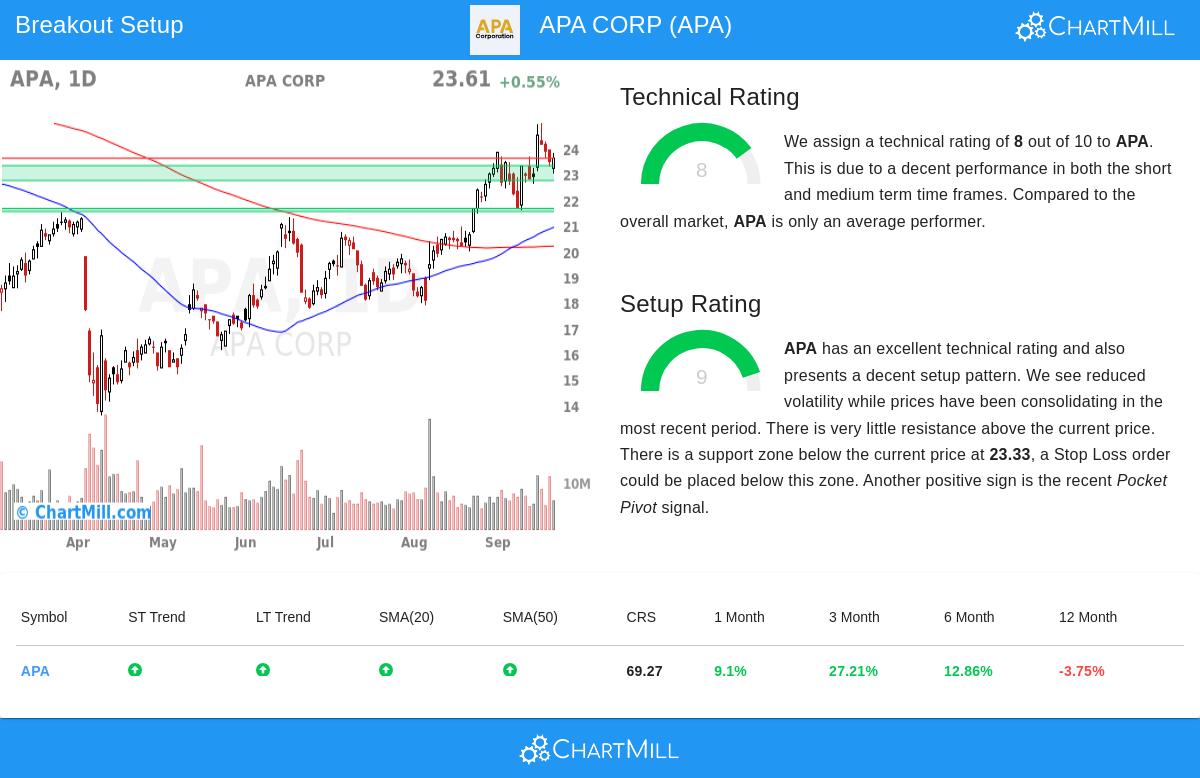
Technical Strength
APA CORP (NASDAQ:APA) demonstrates a solid technical foundation, earning a ChartMill Technical Rating of 8 out of 10. This strong score is critical for the breakout strategy as it confirms the stock is in a healthy uptrend, increasing the probability that a breakout will be sustained rather than falter. The rating is supported by several positive factors detailed in the full technical report.
- Trend Alignment: Both the short-term and long-term trends for APA are positive, a key characteristic of a technically sound stock.
- Industry Leadership: Within the competitive Oil, Gas & Consumable Fuels industry, APA outperforms 76% of its 210 peers, indicating relative strength.
- Price Position: The stock is currently trading in the upper portion of its 52-week range, though it slightly lags the broader S&P 500 index, which is trading near new highs.
The combination of these elements paints a picture of a stock with solid momentum, making it a suitable candidate for a strategy that bets on the continuation of an existing trend.
Setup Quality and Consolidation Pattern
Beyond a strong trend, a high-quality setup is essential for identifying a low-risk entry point. APA performs well here as well, having a top-tier ChartMill Setup Rating of 9. This high score signals that the stock has been consolidating its recent gains, which is a common precursor to a new breakout.
- Bull Flag Formation: The technical analysis identifies APA as currently exhibiting a bull flag pattern. This pattern occurs when a stock pauses or pulls back slightly after a sharp upward move, often leading to a continuation of the prior trend.
- Reduced Volatility and Clear Support: The consolidation has allowed volatility to decrease and has established a well-defined support zone between $22.75 and $23.33. A clear support level is vital as it provides a logical place to set a stop-loss order, defining the trade’s risk.
- Positive Signal: A recent “Pocket Pivot” signal, which indicates accumulation by larger players, provides an additional positive indicator for the setup.
The presence of a clear resistance level at $23.62 gives a specific price point to watch for a potential breakout. A decisive move above this level could signal the start of the next upward phase.
Market Context and Risk Considerations
While the technical and setup scores for APA are positive, investors should consider the broader context. The S&P 500 is in a positive trend both short-term and long-term, providing a supportive backdrop for equity investments. However, as an energy sector stock, APA’s performance is also tied to commodity prices, which introduce their own set of volatilities.
It is also important to note that the automatically generated trade suggestion, which proposes an entry above resistance and a stop-loss below support, results in a relatively tight risk parameter. Investors should evaluate whether this aligns with their personal risk tolerance, as a wider stop-loss may be more appropriate for a longer-term hold.
Discover More Breakout Opportunities
The methodology used to identify APA Corp. can be applied to the broader market to find other potential opportunities. For investors interested in screening for similar technical breakout setups, a curated list is available daily.
You can find more potential breakout candidates by visiting the Technical Breakout Setups screen.
Disclaimer: This article is for informational purposes only and does not constitute investment advice, a recommendation, or an offer to buy or sell any security. All investment decisions involve risk, including the possible loss of principal. Investors should conduct their own research and consult with a qualified financial advisor before making any investment decisions. The technical analysis and trade setup mentioned are generated automatically and are not guarantees of future performance.