


First Horizon Corp (NYSE:FHN) Shows Perfect Technical and Setup Ratings Ahead of Potential Breakout
Our analysis today focuses on identifying potential breakout opportunities by combining two proprietary technical indicators: the ChartMill Technical Rating and the Setup Quality Rating. This methodology is designed to answer two critical questions for traders: which stocks are technically strong, and when might be an optimal time to consider an entry. The strategy filters for equities that are not only in a confirmed uptrend but are also consolidating in a tight range, suggesting a potential breakout move may be imminent. A high Technical Rating (typically 7 or above) confirms the stock’s underlying health and positive momentum, while a high Setup Rating (also 7 or above) indicates a period of consolidation, providing a clearer level for entry and risk management.
Technical Strength
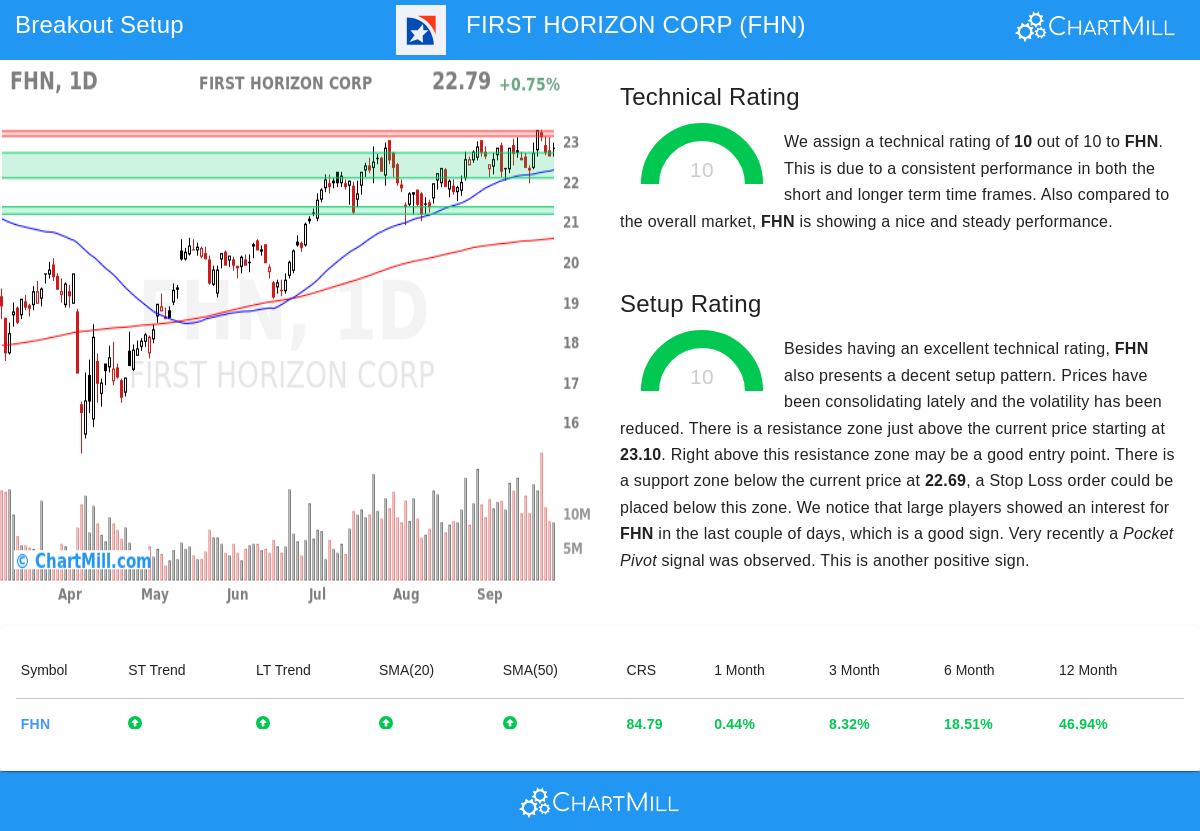
First Horizon Corp (NYSE:FHN) presents a notable technical picture, achieving a perfect Technical Rating of 10. This top-tier score reflects exceptional strength across multiple timeframes and technical metrics. The stock is exhibiting solid momentum, trading comfortably above its key moving averages, which are all trending upward. This alignment of the 20, 50, 100, and 200-day simple moving averages is a classic sign of a healthy, sustained uptrend.
Key technical highlights include:
- Trend Consistency: Both the short-term and long-term trends are rated as positive, a very encouraging sign for continued upward momentum.
- Relative Outperformance: FHN is outperforming 84% of all stocks in the market over the past year and ranks in the top 11% of its industry peers within the Banks sector.
- Proximity to Highs: The stock is currently trading near its 52-week high of $23.26, confirming its position as a market leader.
This strong technical foundation is the first pillar of our breakout strategy, as it ensures we are focusing on stocks with a high probability of continuing their upward trajectory. A detailed breakdown of these factors is available in the full technical report.
Setup Quality and Consolidation Pattern
Beyond its impeccable technical health, FHN earns a perfect Setup Rating of 10, indicating a high-quality consolidation pattern. Over the past month, the stock has been trading within a defined range between $21.94 and $23.26. This period of reduced volatility and sideways action after a prior advance is precisely the kind of base-building that often precedes a significant breakout.
The analysis identifies clear support and resistance levels that are important for trade planning:
- Resistance Zone: A defined resistance area exists between $23.10 and $23.23. A decisive move above this zone could signal the start of the next leg up.
- Support Zone: A strong support zone lies between $22.06 and $22.69, providing a logical area to place a protective stop-loss order should the breakout fail.
Additional positive signals include recent interest from large players, as measured by the Effective Volume indicator, and a recent “Pocket Pivot” signal, which points to accumulation. This combination of a tight trading range, clear price levels, and institutional interest makes the current setup particularly attractive for technical investors looking for a defined risk/reward opportunity.
Potential Trading Setup
Based on this analysis, a potential trading scenario emerges. The strategy would involve placing a buy-stop order just above the resistance zone, around $23.24, to confirm the breakout has begun. A stop-loss order could be placed below the primary support zone, near $22.05, to manage risk. This setup would define a worst-case risk of approximately 5.1% on the trade. It is important to note that this is an illustrative example generated from the technical data; investors should always conduct their own analysis and adjust position sizing and risk levels to align with their individual strategies.
Discover More Breakout Opportunities
First Horizon Corp represents just one example of the potential opportunities identified by this screening methodology. For investors interested in exploring other stocks currently displaying strong technicals and high-quality setups, you can review the live results by visiting the Technical Breakout Setups screen.
Disclaimer: This article is for informational purposes only and does not constitute investment advice, a recommendation, or an offer to buy or sell any security. All trading and investment activities involve risk, and you should conduct your own research and consult with a qualified financial advisor before making any decisions.