


INNODATA INC (NASDAQ:INOD) Shows Strong Technical and Fundamental Momentum
A systematic method for finding high-potential growth stocks combines strict technical analysis with fundamental momentum screening. The method uses Mark Minervini’s Trend Template framework, which finds stocks showing strong uptrend traits, while adding high growth momentum standards to find companies with outstanding earnings and revenue acceleration. This two-part method helps find securities that not only show positive chart patterns but also have the fundamental reasons for continued price increases.
Meeting the Trend Template Criteria
Innodata Inc (NASDAQ:INOD) shows a strong technical profile that matches Minervini’s Trend Template needs. This systematic method focuses on stocks in clear stage 2 uptrends, and INOD meets these important technical points:
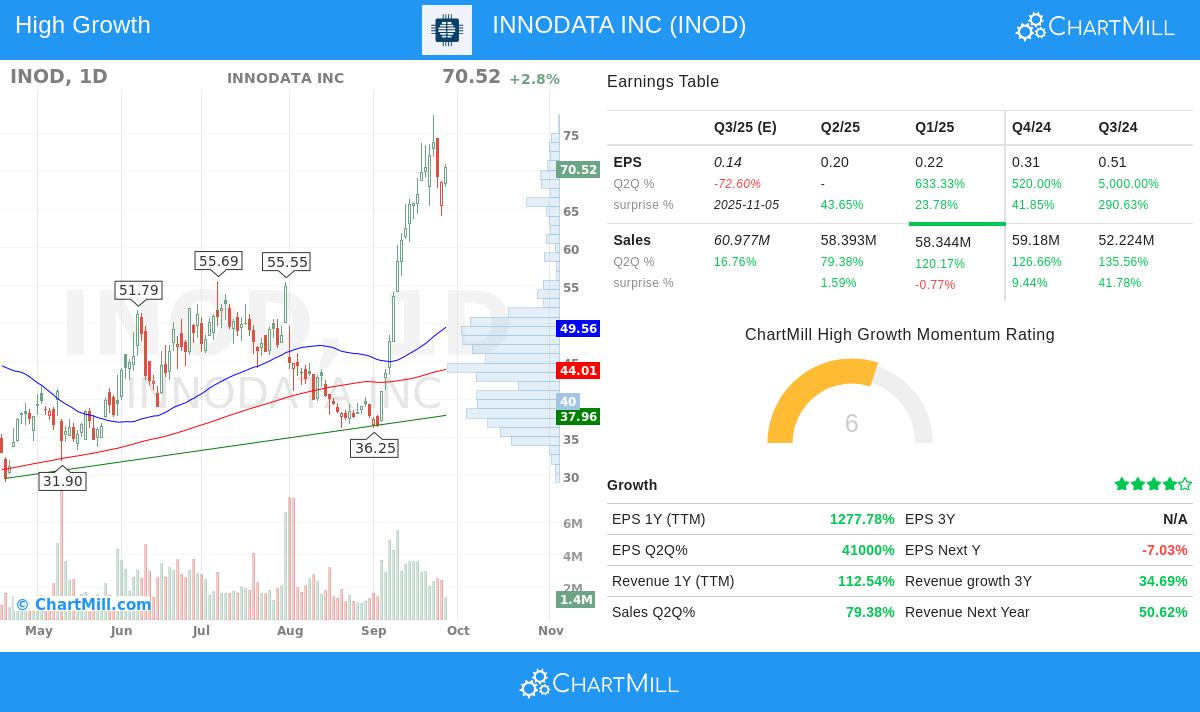
- Current price ($70.52) trades well above its 150-day SMA ($44.96) and 200-day SMA ($44.01)
- All major moving averages (50-day, 150-day, 200-day) show upward slopes
- The 50-day SMA ($49.56) is positioned above both the 150-day and 200-day SMAs
- Current price is about 377% above its 52-week low ($14.79)
- Shares trade within 9% of their 52-week high ($77.47)
- Relative Strength ranking of 98.37 is much higher than the minimum 70 level
These technical traits are important in Minervini’s framework as they find stocks with clear momentum, institutional backing, and a better chance for their uptrends to continue. The template’s moving average arrangement makes sure the stock shows strength across several time periods, while the price level compared to 52-week highs and lows confirms its leading position.
High Growth Momentum Fundamentals
Beyond technical strength, INOD shows remarkable fundamental momentum that makes it suitable for high growth investors. The company’s financial numbers show very strong growth across important measures:
- EPS Growth (TTM): 1,278% year-over-year increase
- Revenue Growth (TTM): 113% year-over-year expansion
- Quarterly EPS Growth: 40,900% compared to same quarter previous year
- Quarterly Revenue Growth: 79% compared to same quarter previous year
- Four consecutive quarters of EPS estimate beats, averaging 99.98% above expectations
- Profit margins showing steady strength at 12.36% in most recent quarter
These acceleration numbers are important for finding companies going through fundamental change points. Minervini’s research indicates that stocks with greatly improving earnings and sales often draw institutional interest, creating a positive cycle of price increases. The outstanding earnings surprise history further shows the company is regularly beating market expectations, a sign of possible top performers.
Technical Health Assessment
INOD’s technical profile gets a perfect 10/10 score from ChartMill’s own evaluation system, showing outstanding trend strength and momentum traits. The stock shows:
- Positive long-term and short-term trends
- Results that are better than 98% of all stocks over the last year
- A leading place within the Professional Services industry, doing better than 97% of similar companies
- A strong volume profile with average daily volume over 2.6 million shares
While the technical score is outstanding, the setup rating of 3/10 implies the stock may be overbought in the short term, having recently traded in a wide span between $36.25 and $77.47. This means possible investors might gain from waiting for a period of stability or a price drop to better entry points instead of buying at current prices.
For a detailed technical analysis including specific support levels and full chart analysis, review the full technical report for INOD.
Investment Considerations
INOD presents a strong case for growth-focused investors looking for companies with both technical momentum and fundamental acceleration. The stock meets the strict standards of the Minervini Trend Template while showing remarkable growth numbers that often come before continued strong performance. However, the overbought short-term setup implies position size and entry timing need thoughtful planning, with possible support areas found between $68.62-$69.36 giving options for risk management.
For investors looking for similar high-growth momentum opportunities that fit the Trend Template standards, additional screening results are available through this link.
Disclaimer: This analysis is for informational and educational purposes only and does not constitute investment advice, recommendation, or solicitation to buy or sell any securities. Investors should conduct their own research and consult with a qualified financial advisor before making investment decisions. Past performance is not indicative of future results.