


Gilead Sciences Inc (NASDAQ:GILD) Shows Strong Technical Setup for Potential Breakout
Technical breakout strategies aim to identify stocks that are both technically sound and forming consolidation patterns, suggesting a potential upward price movement. This approach combines two key metrics: the Technical Rating, which assesses the overall health and trend strength of a stock, and the Setup Quality Rating, which evaluates the quality of its current price consolidation. Stocks scoring highly on both metrics are considered prime candidates for breakout trades, as they represent strong assets positioned for their next move higher. Gilead Sciences Inc (NASDAQ:GILD) recently appeared from such a screening process, indicating it may warrant a closer look from technically-oriented investors.
Technical Strength Assessment
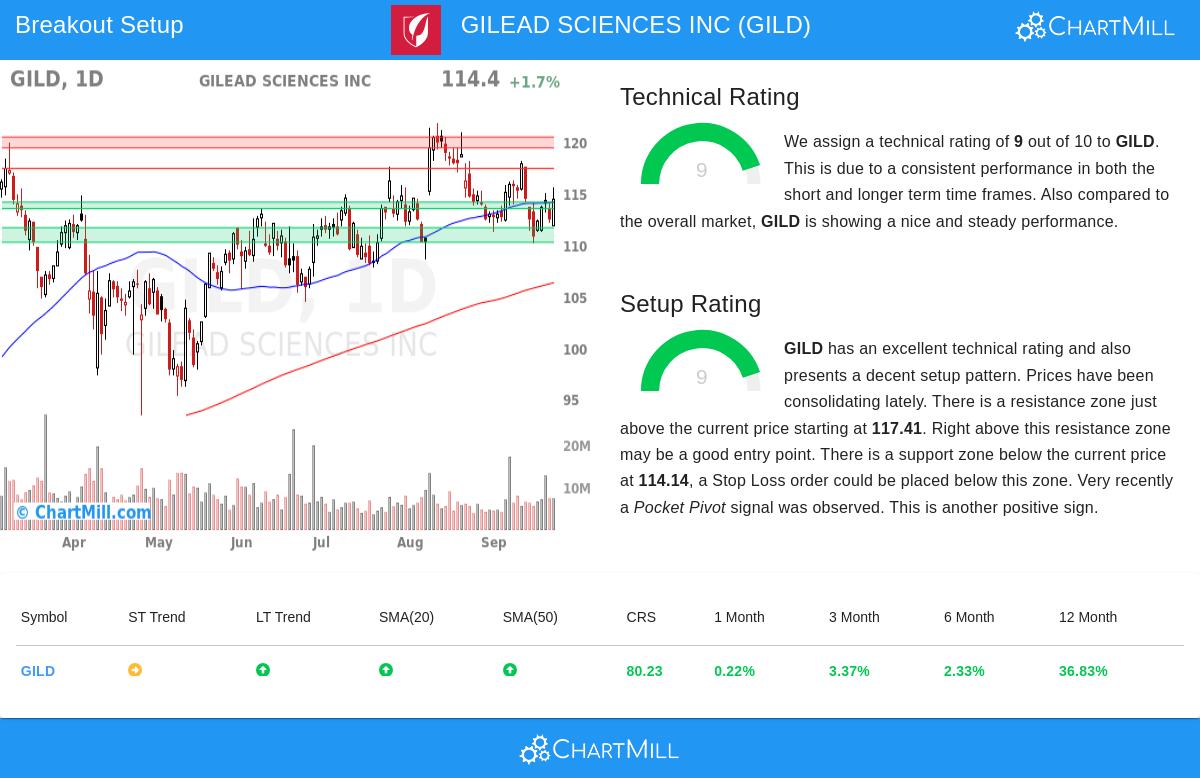
A high Technical Rating is fundamental to this strategy because it confirms a stock is in a established uptrend with positive momentum, increasing the probability that a breakout will be sustained. Gilead Sciences exemplifies this characteristic, with a top-tier Technical Rating of 9 out of 10. This score reflects a solid and consistent performance across multiple timeframes.
Key factors contributing to this strong rating include:
- Sustained Long-Term Uptrend: The long-term trend is firmly positive, a critical foundation for any breakout candidate.
- Impressive Relative Strength: Over the past year, GILD has outperformed 80% of all stocks in the market, demonstrating significant strength relative to the broader universe.
- Price Above Key Averages: The stock is trading above its key moving averages (20, 50, 100, and 200-day), all of which are rising. This alignment indicates broad-based buying support across different time horizons.
- Strong Year-to-Date Performance: The stock has advanced approximately 37% over the past twelve months, with gains distributed steadily over the period.
This combination of factors suggests GILD is a market leader with a healthy technical backdrop, fulfilling the “which stock to buy” component of the breakout strategy. A detailed breakdown of these technical factors is available in the full technical report.
Setup Quality and Consolidation Pattern
While technical strength identifies a promising asset, the Setup Rating addresses the “when to buy” by pinpointing optimal entry points. A high score indicates a stock is consolidating after a prior advance, building a base from which it can break out. GILD’s Setup Rating of 9 signals an excellent consolidation pattern is currently in place.
The analysis reveals a well-defined trading range has developed over the past month, between approximately $110.15 and $118.11. This period of sideways movement has allowed the stock to digest its previous gains and decrease volatility. The setup is further strengthened by the presence of clear support and resistance levels, which are essential for managing risk.
- Resistance Zone: A defined resistance area exists just above the current price, beginning at $117.41. A decisive move above this level could signal the start of a new breakout.
- Support Zone: A strong support zone is identified below, ranging from $113.50 to $114.14, providing a logical area to place a protective stop-loss order.
- Positive Signal: The setup was recently bolstered by a “Pocket Pivot” signal, a volume-based indicator suggesting institutional accumulation.
Trading Implications and Market Context
The combination of a strong technical trend and a high-quality setup presents a clear potential trading scenario. The automated analysis suggests an entry point just above the resistance at $117.42, with an exit stop placed below the support zone at $113.49. This structure defines the trade’s risk at approximately 3.35% from entry to stop-loss. It is important to note that the current positive trends in the S&P 500, both short and long-term, provide a favorable environment for such breakout setups.
This automated setup is an example of how the criteria can be applied; investors should always conduct their own analysis to determine entry, exit, and position sizing that align with their individual risk tolerance. The proximity of the suggested stop-loss to the current price may be too tight for some strategies, and evaluating wider support levels for a longer-term hold could be prudent.
Discovering More Breakout Opportunities
The methodology that identified Gilead Sciences can be applied systematically to uncover new potential trades daily. For investors interested in reviewing a current list of stocks meeting similar technical breakout criteria, the screen is updated regularly and can be accessed here: View Today’s Technical Breakout Setups.
Disclaimer: This article is for informational purposes only and does not constitute investment advice or a recommendation to buy or sell any security. All investments involve risk, including the possible loss of principal. Always conduct your own research and consider your individual financial situation before making any investment decisions.